Evidence demonstrates that research significantly depends on the degree and quality of public participation in project design. This calls for inclusive processes to be used in conjunction with the adoption of robust methodologies that allow concerns of citizens and local communities to be expressed. This requires integrating these concerns into the research cycle at its onset and then facilitating the participation of groups of citizens in all phases of the research process.
The Foundational Play highlights how most contemporary efforts in the data economy lack substantive and effective participation and are often exploitative. Challenge 3 in that Play looks specifically at how structural barriers and capacities play a role in hindering meaningful participation. The strategies therein suggest pathways to solve for issues of representation and diversity for stewarding initiatives.
This Play looks specifically at a key capacity in data stewardship – the technology. Given the intrinsic nature of technology when talking about data collection, sharing and management as well as the near constant use of technology in most data stewardship initiatives, it is of critical importance to understand how existing technological capacities affect participation of communities in stewardship initiatives.
Existing research has shown how various technical barriers and (lack of) capacity has impacted community engagement in digital initiatives. This points to the constant need to consider and adapt new tools and research design channels that allow collective decision-making and shared access to outputs. While selecting the technology, different criteria should be considered, such as ease of use, digital literacy, acceptance levels of tools and the extent to which the intended aim of accessibility and openness is served by the tools. This Play lays down action strategies to be implemented in order to make inclusive participation of communities and individuals technologically feasible.
Diagnosis of challenges – how does lack of technological feasibility hinder data stewardship efforts?

Challenge g2.1
Lack of community participation in the innovation/design process that is hindered due to technical barriers has knock-on effects for community participation in the life cycle of a stewarding initiatives
The large diversity of technology and the lack of a model for describing the possible interactions between people, data, systems and services, is a major barrier to citizen engagement and bottom-up design. Communities are unlikely to engage, identify and then design solutions for civic problems if they do not understand smart technology and how large, complex The large diversity of technology and the lack of a model for describing the possible interactions between people, data, systems and services, is a major barrier to citizen engagement and bottom-up design. Communities are unlikely to engage, identify and then design solutions for civic problems if they do not understand smart technology and how large, complex


Strategy g2.1.1
Using technical tools to enable co-designing with the purpose of furthering effective participation

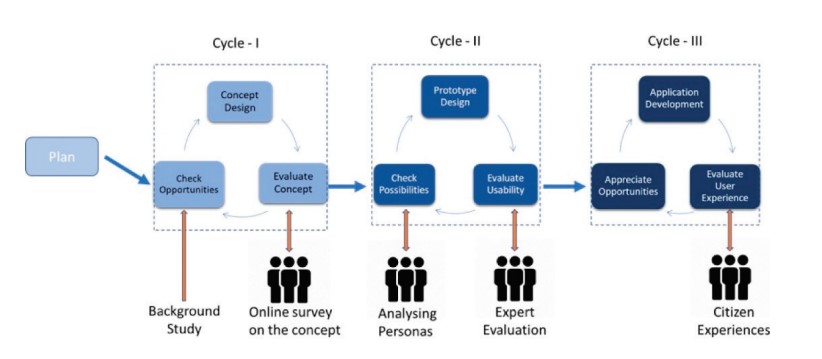
Employing tools to support users to design and implement robust processes can enable effective involvement and help align their objectives and interests that they have in data stewards and related activities. For example, city inhabitants were involved in the co-design of a smart city service prototype using a living lab approach. Living lab is a concept to support user driven ICT systems and its processes. A user centric model was used which contained an iterative process consisting of 3 main cycles that aimed to engage users from the preliminary stages of planning to understand their requirements and to maintain the correlation between usability and features of the application.
A City Commons Framework is another example of a model built on participatory action research that was developed and tested for Citizen Sensing, and designed to orchestrate large scale citizen engagement around urban issues. Voices for Change was a project that also included lay people in the data analysis stage of the research process and their strategy focused on making all aspects of the research process as participatory as possible by involving them as co-researchers.
Challenge g2.2
The chosen technology and its implicit design bias could exacerbate digital divides and inhibit participation based on lack of capacity and access to such technology
To implement these co-designing approaches to their fullest, inclusive processes must be used in conjunction with the development and adaptation of technology that will ensure that the concerns of citizens and local communities be specified and expressed. ICT skills depend on the socio-economic status, educational level, and lack of host society language skills and access to ICTs.
While designing, there must be a collaboration with developers and human-computer interaction (HCI) specialists so that design issues around data quality, sustained participation, and adoption of tools and technologies are better understood. GenderMag for instance, is an effective method that finds and fixes gender inclusivity bugs in software interfaces and workflows to eliminate bias and make the design more inclusive.
Further, web developers need to incorporate WCAG 2.0 Level AA principles – that lay down guidelines to ensure interface components are perceivable, operable, understandable and predictable. These guidelines seek to make web content more accessible and usable to a wider range of people. These principles state that information and user interface components need to be presented in a way that users can perceive, understand and can easily navigate. The overall interface design should also take into account cultural and environmental characteristics. There is a need to ensure early engagement with end users by placing the user at the centre of the design and development lifecycle.
Strategy g2.2.1
Employing tools that make technology and data more accessible

There is a need for the technology infrastructure to support the inclusion of community. This could be done by employing tools that enable data automation and visualisation to enhance the ability of citizens to easily navigate and perceive data that is being collected and analysed. Tools that enable training boost learner opportunities and enable learners to collaborate. Further communicating to the data subjects on data access requests will increase transparency and help build trust within the community. Tools that help in data standardisation, automation for continuous monitoring of data and comprehensive data quality assessments also need to be used. Simple tools like Google Charts (an interactive web service that creates graphical charts from user-supplied information) also provide a quick means of visualising data online as configurable charts and graphs.
Tools that enable standardisation and automation increase efficiency by improving the quality of data and by increasing ease of access and use. There is a need for the technology infrastructure to support the inclusion of community. This could be done by employing tools that enable data automation and visualisation to enhance the ability of citizens to easily navigate and perceive data that is being collected and analysed. Tools that enable training boost learner opportunities and enable learners to collaborate. Further communicating to the data subjects on data access requests will increase transparency and help build trust within the community. Tools that help in data standardisation, automation for continuous monitoring of data and comprehensive data quality assessments also need to be used. Simple tools like Google Charts (an interactive web service that creates graphical charts from user-supplied information) also provide a quick means of visualising data online as configurable charts and graphs. Tools that enable standardisation and automation increase efficiency by improving the quality of data and by increasing ease of access and use.

Challenge g2.3
Lack of quality data and validation mechanisms can result in misuse and distrust rendering such data unsuitable for research or policymaking
Lack of quality data and validation mechanisms leave room for a number of risks. These risks include misuses of personal information, the use of inaccurate or incomplete information or its transmission at the wrong time or distance. Additionally, also of concern in the environmental space is the need to find data that is right for the particular objectives sought to be studied, i.e., data that is fit for purpose. The absence of consensus on a good strategy for de-identifying and aggregating data is a major issue for quality improvement, as it is for much public policy and research.

Strategy g2.3.1
Employing data verification mechanisms and maintaining extensive metadata
Data quality assessments must be undertaken which include cleaning, comparison with authoritative data, linked data analysis, semantic harmonisation and model-based validation.
This could help improve the quality and veracity of the data through various phases of the research cycle. Further, extensive metadata helps create context and is helpful to communicate the ‘known quality’ of the data. Communicating the context in which a particular high-volume data set has been created enables data re-use. Such contextualisation and creation of metadata becomes extremely relevant when a dataset is applied for another purpose or combined with other datasets and reused for research or policymaking.
For instance, smart city data relies on large-scale deployment of devices from multiple vendors and networks – in such a dynamic environment, the quality of data collection samples will inevitably be compromised. This could be solved with the use of lightweight dynamic semantic models that help provide interoperable descriptions of data, their quality and attributes. Thus, quality can be updated by data processing software and APIs. This is particularly useful for aggregate data that gets integrated from various sources, wherein the provenance parameters could help trace the quality of information for each source and the quality aspects of the processing algorithms applied to data.